How to track your SaaS’ carbon footprint on AWS
Software is becoming an increasingly large contributor to the world’s carbon emissions, and technology workers have a civic responsibility to minimize the climate impact of the systems we build. There is no such thing as a free lunch, and every bit of compute used by software has some CO2 cost attached to it—even if your data center is running on 100% renewable energy.
Green software engineering is an emerging discipline within the field that is concerned with building applications in a carbon-efficient manner. Optimizations can be as small as saving a bit of bandwidth in your CI/CD runs, to as large as a complete architectural overhaul of your system.
In much the same way that we benchmark performance before making algorithmic tweaks to a hot path, we must also measure our system’s CO2 footprint before it’s possible to meaningfully optimize emissions. In general, doing this is a pretty tall order. It’s easy to measure power consumption, but much harder to convert that power figure into a CO2 equivalent as there’s a lot of confounding variables to consider. Fortunately, if you’re running on the AWS cloud then there is a tool available which makes tracking CO2 metrics much easier.
Accessing the Customer Carbon Footprint Tool
Navigate to “Billing and Cost Management” and then scroll all the way down to the bottom of the sidebar. Nested under the “Legacy Pages” section is a link to a page labelled “Cost and Usage Reports.” This is the link you’re after. On this page you will be able to find the Customer Carbon Footprint Tool.
Why is this under “Legacy Pages”?
I hope it’s merely an indicator that the page is using the design language from before the latest UI rework, and that the Customer Carbon Footprint Tool is pending a refresh. I can’t imagine AWS choosing not to invest further in this tool.
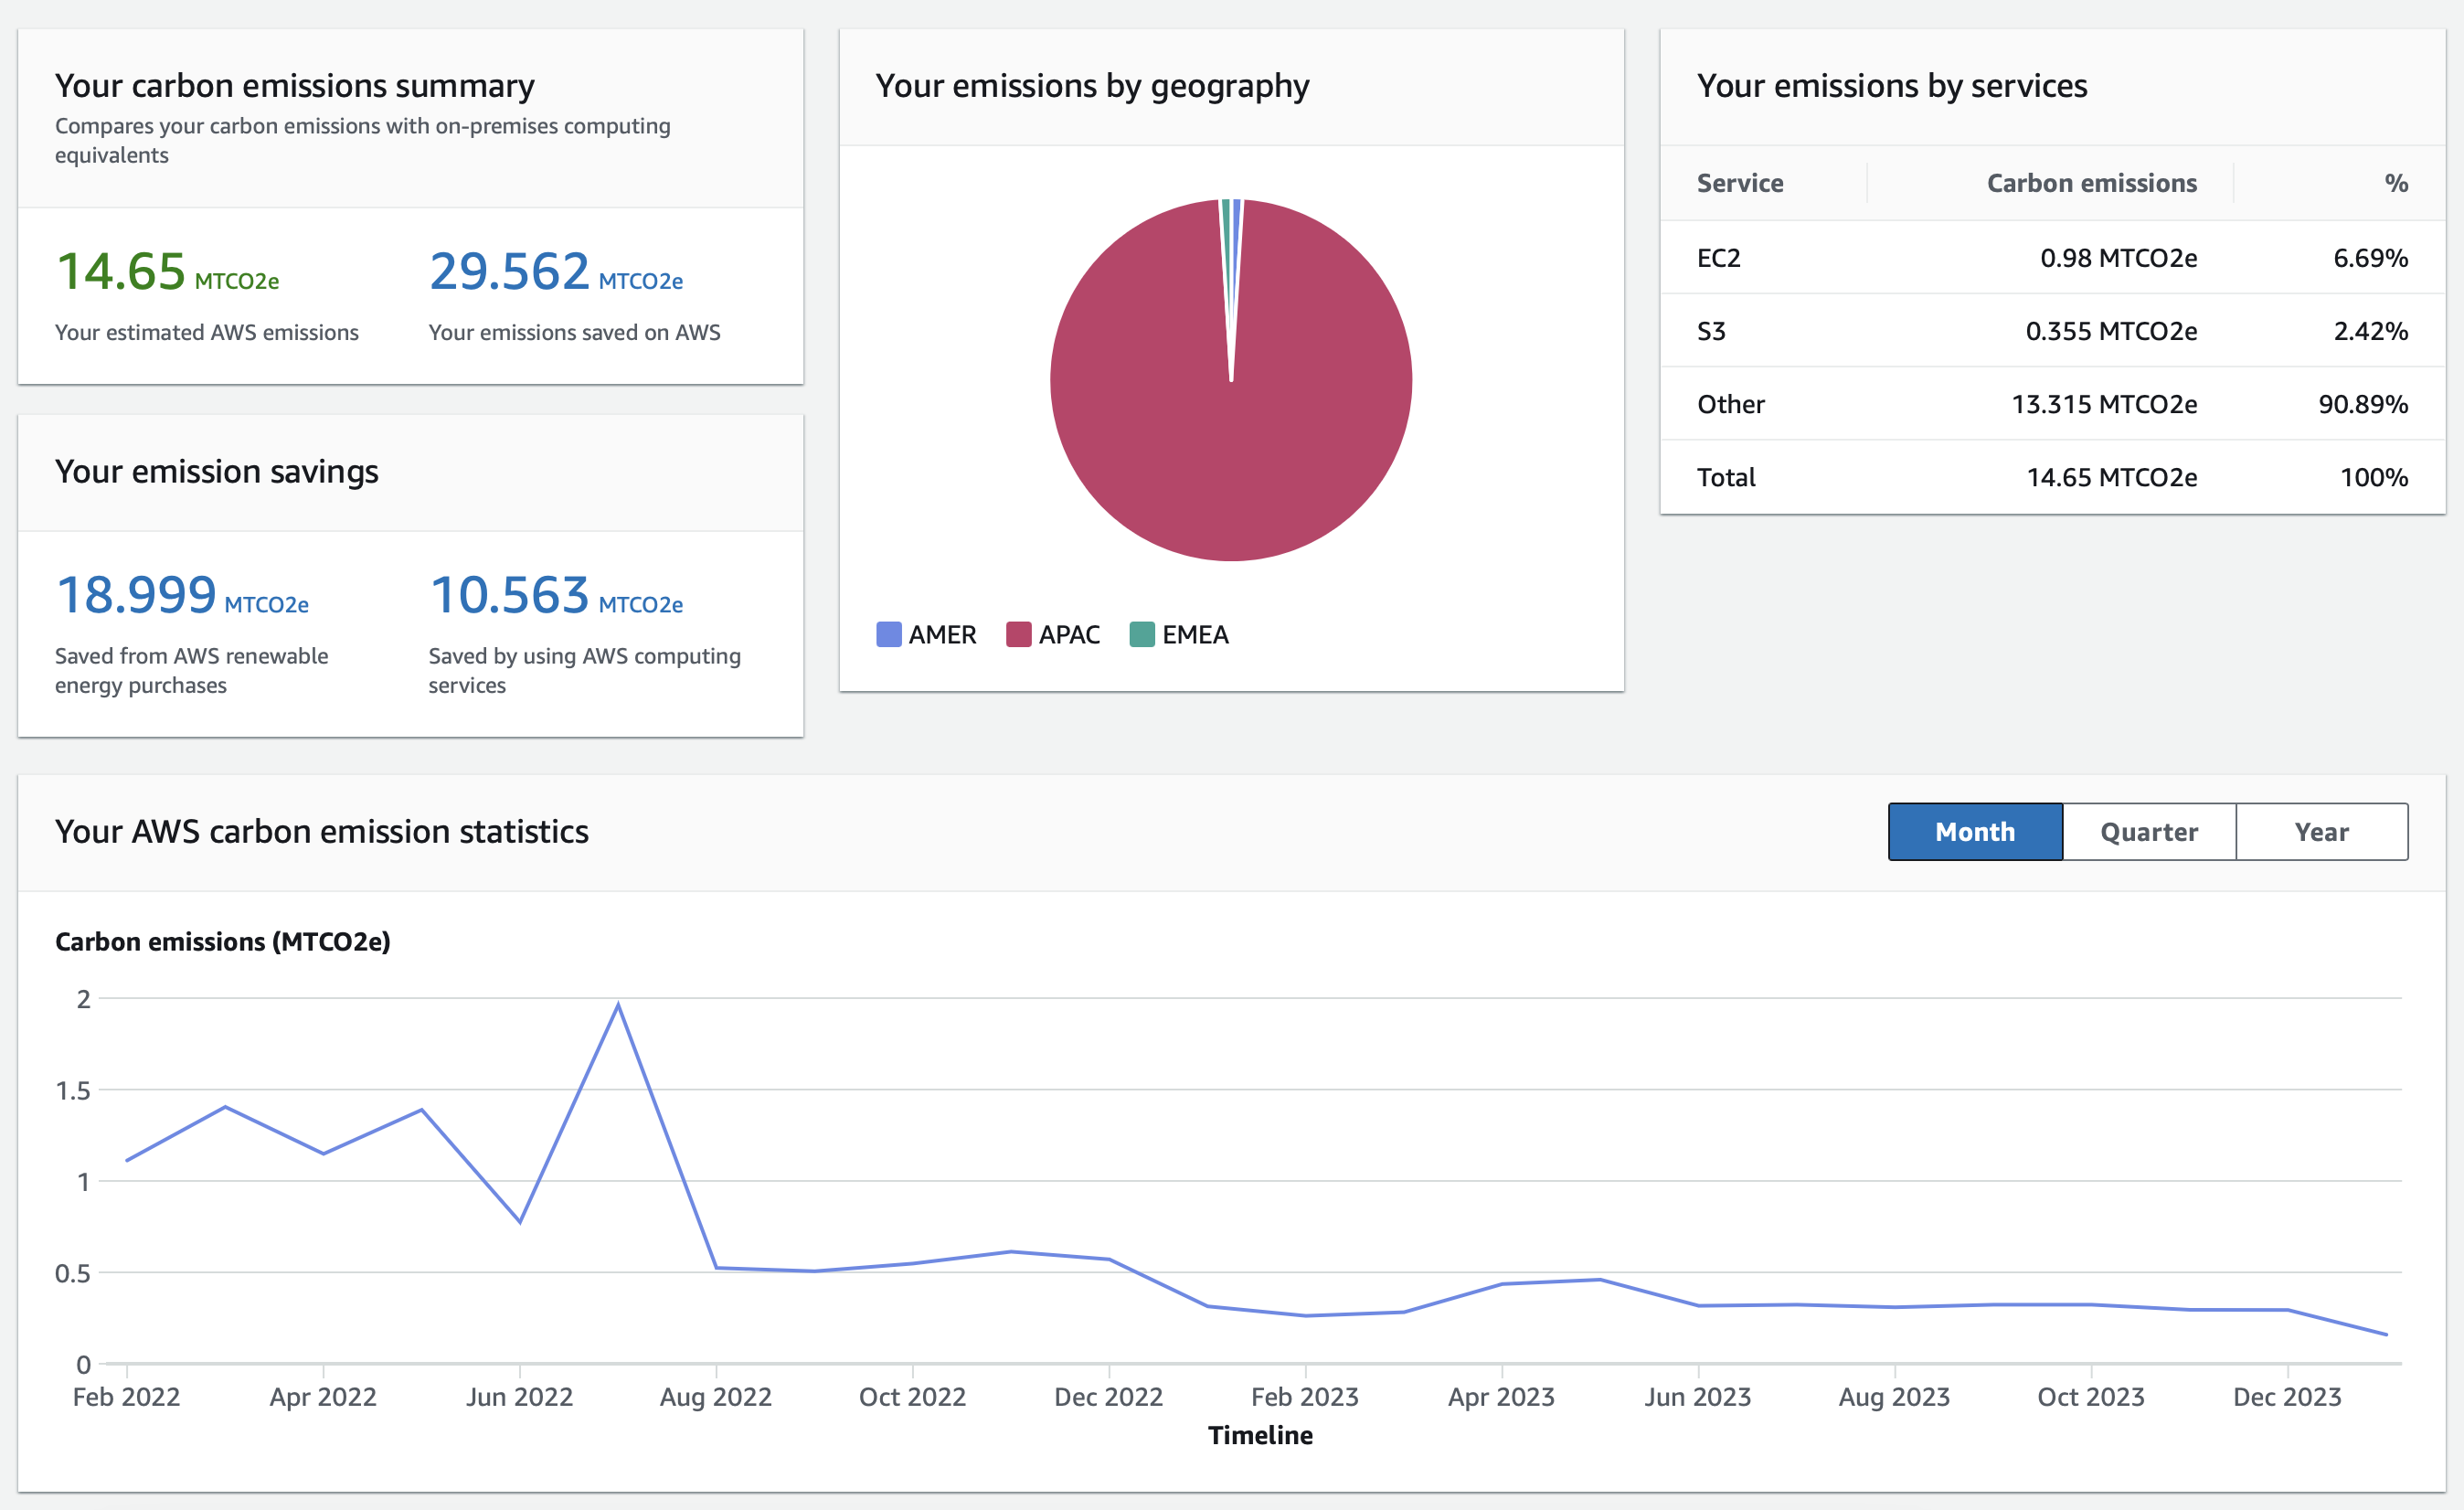
Here is what the tool looks like; this particular account has done a good job of reducing its emissions over time:
Making sense of the Customer Carbon Footprint Tool
There are two big things to keep your eye on when using this tool:
- The green number in the top-left corner displays your total estimated CO2 emissions. You want this to grow as slowly as possible.
- The graph at the bottom of the page shows your CO2 emissions per unit time over the time period you’ve selected on the dashboard. Lower values on the Y axis are better.
The emission breakdowns are somewhat useful, but they lack granularity which limits their value. The figures estimating how much CO2 has been “saved” through using AWS is—in my opinion—marketing fluff that you can largely ignore. It’s really easy to overprovision cloud resources—much more so compared to on-prem deployments—which means that this comparison often isn’t like-for-like. This measure assumes you need instances of the size you’ve provisioned, even in cases where they are surplus to requirements.
That’s not to say there are no benefits to shared clouds from a climate perspective. All of the major cloud providers have made extreme investments into their hardware, and it’s nigh impossible for anyone outside of the major hyperscalers to achieve the degree of operational efficiency that AWS has. Everything about the hardware stack has been optimized for
Limitations
Region and service granularity
The tool isn’t perfect. Note, for instance, how broad the geographic breakdown is. America, APAC, and EMEA are extremely large parts of the world and don’t correspond to individual AWS Regions. If you were hoping to get a quick win by lifting and shifting your infrastructure to a different nearby region then you are out of luck, and there isn’t a particularly easy way of doing this even outside of the AWS Console.
The official recommendation by AWS is for you to independently look at data from a website called “Electricity Maps” to see which countries have lower carbon intensity, and then using that information to infer which AWS Region will result in the lowest carbon footprint.
It’s a bit disappointing given AWS’ otherwise quite lofty sustainability initiatives. Region selection is extremely an extremely high leverage decision, especially given how trivial it is to pick a different one at the start of a project.
Using broad averages from a geography isn’t guaranteed to be accurate, either. If you take GCP as an example, the Los Angeles and Las Vegas regions are right next to each other and yet have big differences in climate footprint. The LA region runs on 55% carbon-free energy, while LV runs on only 13%.
It would be very nice to see a more granular breakdown by region here. Same goes for the service breakdown—the “Other” category making up over 90% of my account’s emissions is pretty bad.
Tag breakdowns
The other thing that’s notably absent is the ability to break down CO2 emissions by resource tags. It feels a bit strange given that this tool is nested under Cost and Billing Management, where other pages have tight integration with cost allocation tags. The Customer Carbon Footprint Tool only reports a single monolithic value across the AWS account it’s run inside.
If your organization is all-in on the Well Architected framework then this limitation isn’t as bad. Getting really granular with your AWS accounts lets you optimize across most of the Well Architected pillars simultaneously. If you’re running an architecture where each individual application has its own account for each region for each environment then you’ll end up with reasonably granular CO2 measurements.
If you want to IaC your AWS accounts setup with Terraform, I have a tutorial for that here.
Most organizations don’t have that level of operational excellence, however. If you’re a scrappy startup with a couple AWS accounts that do a mix of everything then you’ll find it hard to use the figures from this tool to make better climate decisions. It’s just really difficult to identify opportunities for improvement when you don’t know where the most carbon-intensive parts of your application are.
Combining Customer Carbon Footprint Tool with ETL
While there is no official API available, there is a collection of Lambda functions available under the aws-samples GitHub account which can be used to extract your CCFT values through scraping the AWS dashboard. The code can be retrieved here.
The code comes in the form of a SAM application. A Step Function is defined with five different stages, each responsible for a different part of extracting and loading the emissions data. Data is downloaded from the CCFT dashboard itself in the form of CSV files, those CSV files are then uploaded to an S3 bucket, and then finally an Athena view is created over that S3 bucket for analytics purposes.
We can break it down like this:
- List out all of the account IDs inside your AWS organization.
- Check if the Step Function has been executed before. This is determined by whether the target S3 bucket is empty.
- If this is the first invocation, CO2 emissions are downloaded and uploaded to S3 and then an Athena view is created over that S3 bucket.
- Otherwise, a Lambda is executed which downloads the latest CO2 emissions from the root account.
- If new data has been found, then all accounts in the organization are processed.
- The state machine schedules itself to run again after 1 day.
This sample is helpful, because building this yourself is a pain.
You might not be using Athena for BI—I’ve never done so personally. This isn’t a blocker for using this code, though, because of how the workflow stashes the CCFT data files in S3. All off-the-shelf ETL tools I’m familiar with have support for loading data from this very source. In particular, Stitch is easy to get set up with, and supports piping these CSV files to a wide variety of databases.
All you need to do (if you desire) is to get rid of the step which creates the Athena view. The rest of the code can be used unmodified.