Identifying slow PostgreSQL queries
At my job I’ve been working on identifying performance and stability issues with our main web application, the Crimson App. As the business continues to scale and expand into new markets we are—like many startups—increasingly running in to limitations with this relatively old and creaky codebase. Scalability issues are the best kind of issue you can have.
What’s causing our current wave of performance issues? Database queries that do way too much work. In this post I’ll show you how to find these queries so you can fix them.
The pg_stat_statements view
pg_stat_statements is a PostgreSQL extension introduced in version 8.4 which tracks system-level metrics for all SQL statements executed by your database. You can use it to drill down and find out the following:
- Which queries take up the most time to run
- Which queries are run most frequently
- How long each query takes to run on average
- How many rows were retrieved or affected by each query
- …and a lot more
While you can use nice GUI tools like Datadog’s Database Monitoring or Amazon RDS Performance Insights to answer questions about database performance, I tend to avoid using them. The two problems with tools like these is that building expertise with one often won’t translate over to your next job—you won’t have RDS Performance Insights at an Azure shop—and they often add a nontrivial amount of cost.
pg_stat_statements is included in the contrib module, which means it’s available out of the box with any standard PostgreSQL release. In fact, depending on which provider you’re using to host your database you may even find the extension is turned on for you automatically. Amazon RDS, for instance, automatically enables pg_stat_statements for all RDS instances running PostgreSQL 11 and newer.
And because it’s just a standard PostgreSQL extension, there is no added cost to using it other than the storage used by the extension.
Finding slow queries
Here’s my go to query:
select
  substring("query", 1, 150) as "query_start",
  total_exec_time,
  calls,
  rows / calls as "rows_per_call",
  mean_exec_time,
  (100 * total_exec_time / sum(total_exec_time::numeric) over ())::numeric as "cpu_percent"
from pg_stat_statements
There are a lot of columns inside the pg_stat_statements view, but the ones selected by this query are the most useful in my experience. Depending on what you’re trying to debug, you may want to play around with order by here.
Note
If you have an old database it may be worth running pg_stat_statements_reset() to get rid of any old statement statistics.
The key things to look out for here are queries with high values of cpu_percent, rows_per_call, and/or calls. High values for these metrics are a tell-tale sign of a query that’s likely going to be a performance bottleneck.
A real-world example
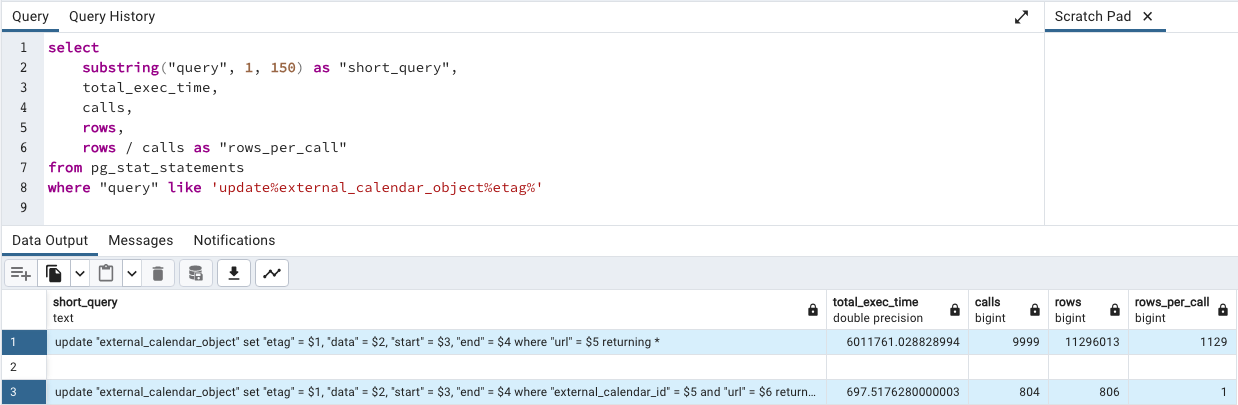
When I inspected the Crimson App database’s pg_stat_statements, I found that the following query was among our slowest:
update "external_calendar_object"
set "data" = $1
where "url" = $2
I took a look at the table and found that an index on url had been added a few days ago by a different engineer who had also noticed this issue. This index hadn’t really improved the situation, however, and this query was still pathologically slow.
Index type matters
The default PostgreSQL index type is a B-Tree. It’s a good all-rounder, but in the case of a url column it is unlikely we will ever need to make comparisons or sort on it. A hash index type is likely more appropriate, and yields 10-22% better performance on equality filters like the one in our update.
The reason why the index didn’t fix anything is because this query was actually doing far more work than it appeared. Because my pg_stat_statements query includes a rows_per_call calculation, I was able to see that this query was updating an average of *1,139 rows every single time it ran.
Multiply that by a few hundred thousand calendar objects being synced per day and you can see why this query was burning so much CPU and disk time.
It turns out that even though the url of our calendar object gets prefixed with the url of the calendar it belongs to, it isn’t guaranteed to be unique. The “Birthdays” and “Public Holidays” calendars Google makes available to you aren’t actually real calendars; they’re “virtual calendars” with the same URL for everyone who uses Google Calendar.
Check out the following result I get from hitting calendarList.list on my personal Google account. You can see that the “Appointments” calendar I created myself has a fairly random-looking id while the automatic “Birthdays” calendar has an id that is quite human-readable.
{
 "kind": "calendar#calendarList",
 "items": [
  {
   "kind": "calendar#calendarListEntry",
   "etag": "\"1640219127975000\"",
   "id": "6bqbic3u01rrltgcnu4ikorjgg@group.calendar.google.com",
   "summary": "Appointments",
   // ...
  },
  {
   "kind": "calendar#calendarListEntry",
   "etag": "\"1640219158675000\"",
   "id": "addressbook#contacts@group.v.calendar.google.com",
   "summary": "Birthdays",
   // ...
  },
  // ...
 ]
}
Crimson App syncs calendars using the CalDAV protocol instead of the REST API and the values there look slightly different, but the same general concept applies.
The events inside these virtual calendars are also themselves virtual. The event for your personal birthday has the same virtual url as someone else’s personal birthday event.
That means that whenever we were syncing someone’s personal birthday event, we wound up applying that update to everyone’s birthday calendar. The result is an exponential increase in workload (N calendars * M events), rather than the linear increase we would ordinarily expect.
I discovered the duplicate url values by running the following query, and noting that I had rows come back where count > 1:
select
  count(*) as "count",
  "url"
from "external_calendar"
group by "url"
In this particular case, however, there was another way we could have identified this issue. We limit the concurrency of our calendar syncer, and there has always been a big scary comment warning us about bumping the concurrency too high. Doing so would allegedly result in database deadlocks.
That comment doesn’t make a whole lot of sense at first glance, but in retrospect things are a lot clearer. We had assumed each calendar sync was isolated from other syncs, and that’s not the case due to these virtual calendars. Because we run each calendar sync in a transaction and these transactions can potentially touch the same rows, it is entirely possible for these operations to deadlock.
Either way you diagnose it, the actual fix is pretty easy you know what the problem is. All you need to do here is scope the update to a single calendar by adding a filter on external_calendar_id.
update "external_calendar_object"
set "data" = $1
where "external_calendar_id" = $2
and "url" = $3
We no longer need the url index at this point; it can be dropped in favor of either a simple hash index on external_calendar_id or a composite index on (external_calendar_id, url).
The effect of this refactor was that rows_per_call immediately dropped down to 1, meaning that our calendar sync is now performing a thousand times less work. That update no longer shows up as one of our most expensive SQL statements.
Adding indexes on columns which appear in slow queries is usually an OK strategy in the absence of good metrics. The engineer who attempted to index url wasn’t necessarily wrong for doing so—they just didn’t have time to thoroughly dig in to the issue.
Once you do look a bit deeper it becomes obvious that adding an index will barely move the needle. Indexes aren’t capable of overcoming code that’s 1,000x slower than it needs to be.
In this case, the big smoking gun is that rows_per_call value. While 1,139 is a pretty extreme value, the key thing to keep in mind here is that any value greater than 1 signifies a buggy calendar sync implementation.
Takeaways
pg_stat_statements is a handy extension which automatically tracks query performance metrics and compiles them into a view which you can query. As it’s a standard PostgreSQL module, it will be available to you wherever you can run a PostgreSQL database. The lack of vendor lock-in combined with its ubiquity makes this extension well worth your time to learn.
The main metrics to look at are usually execution time, rows/call, and number of calls. These metrics alone are capable of identifying most performance issues you’re likely to run into in production, and you can quickly inspect them with a canned query. I’ve provided one earlier in this post which you can copy/paste whenever you need to inspect your pg_stat_statements view.
If those metrics prove insufficient then there are many more advanced metrics available, all of which are documented in the PostgreSQL docs site.