Set up monitoring for unauthorized AWS API access
AWS CloudTrail is an indispensable tool for improving your security posture, but it’s sadly underused by a lot of young companies. While most startup cloud engineers are familiar with common application services like EC2 and S3, CloudTrail is very much a platform or security engineer’s service. It’s just not a tool most product engineers have ever needed to know about or use.
One quick win you can get from CloudTrail which will immediately improve your security posture is to set up monitoring and alerting for unauthorized AWS API calls. With Terraform or another IaC tool it’ll take only a few minutes to get done.
Unauthorized API calls can signal a variety of different things that are worth keeping track of:
- Incorrectly configured IAM policies
- Hijacked application images
- Attackers using old credentials
In all of these scenarios you’ll want a proactive heads up so that you can investigate and resolve the issue. For these issues you aren’t necessarily able to rely on your monitoring and observability platform because the failures are either not coming from inside an application, or they’re coming from a hijacked application where an attacker can hide their activity. CloudTrail is the best and most reliable solution.
How to set up the infrastructure
Step 1: Set up a bucket
Even if you don’t want to use S3 for storage or analysis, trails must have a bucket configured anyway. The minimum IAM actions required here are s3:GetBucketAcl and s3:PutObject.
The below Terraform is something you’ll see every time you create a new trail:
data "aws_caller_identity" "current" {}

resource "aws_s3_bucket" "this" {
  # Note: S3 bucket names must be globally unique.
  bucket = "${data.aws_caller_identity.current.account_id}-cloudtrail-bucket"
}

# Give CloudTrail access to the bucket
data "aws_iam_policy_document" "bucket" {
  statement {
    actions   = ["s3:GetBucketAcl"]
    effect    = "Allow"
    resources = [aws_s3_bucket.this.arn]

    principals {
      type        = "Service"
      identifiers = ["cloudtrail.amazonaws.com"]
    }
  }

  statement {
    actions   = ["s3:PutObject"]
    effect    = "Allow"
    # CloudTrail files are always under an AWSLogs/ key prefix
    resources = ["${aws_s3_bucket.this.arn}/AWSLogs/*"]

    principals {
      type        = "Service"
      identifiers = ["cloudtrail.amazonaws.com"]
    }
  }
}

resource "aws_s3_bucket_policy" "this" {
  bucket = aws_s3_bucket.this.bucket
  policy = data.aws_iam_policy_document.bucket.json
}
Step 2: Set up a log group
When setting up a trail you can configure it to deliver recorded events to a CloudWatch log group in addition to an S3 bucket, and for our purposes we’ll do this. CloudWatch allows us to aggregate log messages into metrics, and we can create alarms based on those metrics.
S3 allows us to attach policies directly to bucket(s), but for CloudWatch we need to create a new IAM role with write permissions for our log group that our trail will assume.
resource "aws_cloudwatch_log_group" "this" {
  name = "/cloudtrail/main"
}

# Allow CloudTrail to assume our new role
data "aws_iam_policy_document" "cloud_trail_assume" {
  statement {
    actions = ["sts:AssumeRole"]
    effect  = "Allow"

    principals {
      type        = "Service"
      identifiers = ["cloudtrail.amazonaws.com"]
    }

    # Note: Possible to enhance security with condition blocks
  }
}

# Create role
resource "aws_iam_role" "cloud_trail" {
  name               = "cloudtrail-role"
  assume_role_policy = data.aws_iam_policy_document.cloud_trail_assume.json
}

# Give role write permissions to our log group
data "aws_iam_policy_document" "cloud_trail" {
  statement {
    actions   = ["logs:CreateLogStream", "logs:PutLogEvents"]
    effect    = "Allow"
    resources = ["${aws_cloudwatch_log_group.this.arn}:*"]
  }
}

resource "aws_iam_role_policy" "cloud_trail" {
  name = "cloudtrail-policy"
  role = aws_iam_role.cloud_trail.id

  policy = data.aws_iam_policy_document.cloud_trail.json
}
Step 3: Create the trail
With our two storage destinations created and the IAM legwork out of the way, we’re now free to create the actual trail.
You can get a taste for how simple the CloudTrail service is from the below Terraform, as the resource for a trail is simply named aws_cloudtrail. There’s only one other resource type with an aws_cloudtrail prefix, which is a stark contrast to more complex services like RDS or Lambda. CloudTrail has very few concepts to learn, which is part of the reason why it’s such a shame that smaller organizations don’t leverage it more.
With a few lines of Terraform we can create the trail and configure it to deliver events to our S3 bucket and CloudWatch log group:
resource "aws_cloudtrail" "this" {
  name                       = "cloudtrail"
  s3_bucket_name             = aws_s3_bucket.this.bucket
  cloud_watch_logs_group_arn = "${aws_cloudwatch_log_group.this.arn}:*"
  cloud_watch_logs_role_arn  = aws_iam_role.cloud_trail.arn

  # Ensure S3 bucket policy gets applied first
  depends_on = [aws_s3_bucket_policy.this]
}
If you click around the console or hit an AWS api, you’ll be able to see events start to appear inside the S3 bucket and CloudWatch log group. CloudTrail events are JSON documents, which makes querying and analyzing them very straightforward. CloudTrail emitting JSON is the reason why we set up a CloudWatch log group in the first place: CloudWatch has native support for querying structured JSON logs, and also has support for raising alarms.
The alternative would have been to set up a Lambda function that runs on every new object created inside the S3 bucket and then manually implementing a monitoring solution from there. This would be significantly more complicated than stringing together AWS’ built-in offerings.
Step 4: Create the metric filter
A “metric filter” is the AWS resource that aggregates CloudWatch logs into metrics that can be monitored and alerted on. All AWS services natively send metrics to CloudWatch (here are RDS’ CloudWatch metrics, for instance), but it’s also possible to define your own custom metrics. Metric filters are one way of doing that.
They consist of two components
- A “pattern.” You could more accurately call this a filter—it’s the CloudWatch query that gets run against your log messages to determine whether the message is relevant for your metric.
- A “transformation.” This is where you configure how relevant log messages contribute to your custom metric. This could be something like adding a static number to the metric’s value, or extracting a number from the log message to use as the metric value.
In our case we’re interested in log messages about API calls that resulted in an UnauthorizedOperation or AccessDenied error. When we match a log message we’ll add 1 to our metric value, which will effectively function as a count of these log messages.
locals {
  metric_name = "unauthorized_api_calls"
}

resource "aws_cloudwatch_log_metric_filter" "this" {
  name           = local.metric_name
  pattern        = "{($.errorCode = \"*UnauthorizedOperation\") || ($.errorCode = \"AccessDenied*\")}"
  log_group_name = aws_cloudwatch_log_group.this.name

  metric_transformation {
    name      = local.metric_name
    namespace = "CISBenchmark"
    value     = "1"
  }
}
Step 5: Set up an alarm
With the metric filter created, we can now set up an alarm that will get triggered based on the value of our metric. When our alarm gets triggered we’ll notify an SNS topic, and we’ll set up an email subscription to that SNS topic. The result we’re looking for is to receive an email whenever an unauthorized API call occurs.
SNS supports a wide variety of subscription formats. Instead of an email you may prefer receiving an SMS, or you might want to trigger a Lambda function for maximum flexibility.
resource "aws_sns_topic" "this" {
  name = "${local.metric_name}-events"
  # Can use SSE here by specifying a KMS key
  # The AWS-managed key does not work, as you will need
  # to attach an IAM policy to the key granting CloudWatch
  # access to it.
}

resource "aws_sns_topic_subscription" "email" {
  topic_arn = aws_sns_topic.this.arn
  protocol  = "email"
  # Swap with your own email
  endpoint  = "hello@sophiabits.com"
}

resource "aws_cloudwatch_metric_alarm" "this" {
  alarm_actions = [aws_sns_topic.this.arn]
  alarm_name    = "${local.metric_name}-alarm"

  comparison_operator = "GreaterThanOrEqualToThreshold"
  evaluation_periods  = 1
  metric_name         = local.metric_name
  namespace           = "CISBenchmark"
  period              = 300
  statistic           = "Sum"
  threshold           = 1
}
After running terraform apply you’ll receive an email from no-reply@sns.amazonaws.com asking you to confirm your subscription to the created SNS topic. Click the “Confirm subscription” link in that email to do so.
Step 6: Test it
After confirming your SNS subscription, it’s a good idea to test the infrastructure to ensure everything is working as expected. This is especially important to do for anything security-related, as a false sense of security in combination with no security is far worse than “just” having no security.
Testing is easy. Simply create a new IAM user with no permissions, acquire an access key, and then try to do something with the AWS CLI using those credentials. Note that the trail we created in this post is regional—you need to set is_multi_region_trail on the aws_cloudtrail resource to create a global one—so make sure you run your AWS CLI command in the correct region.
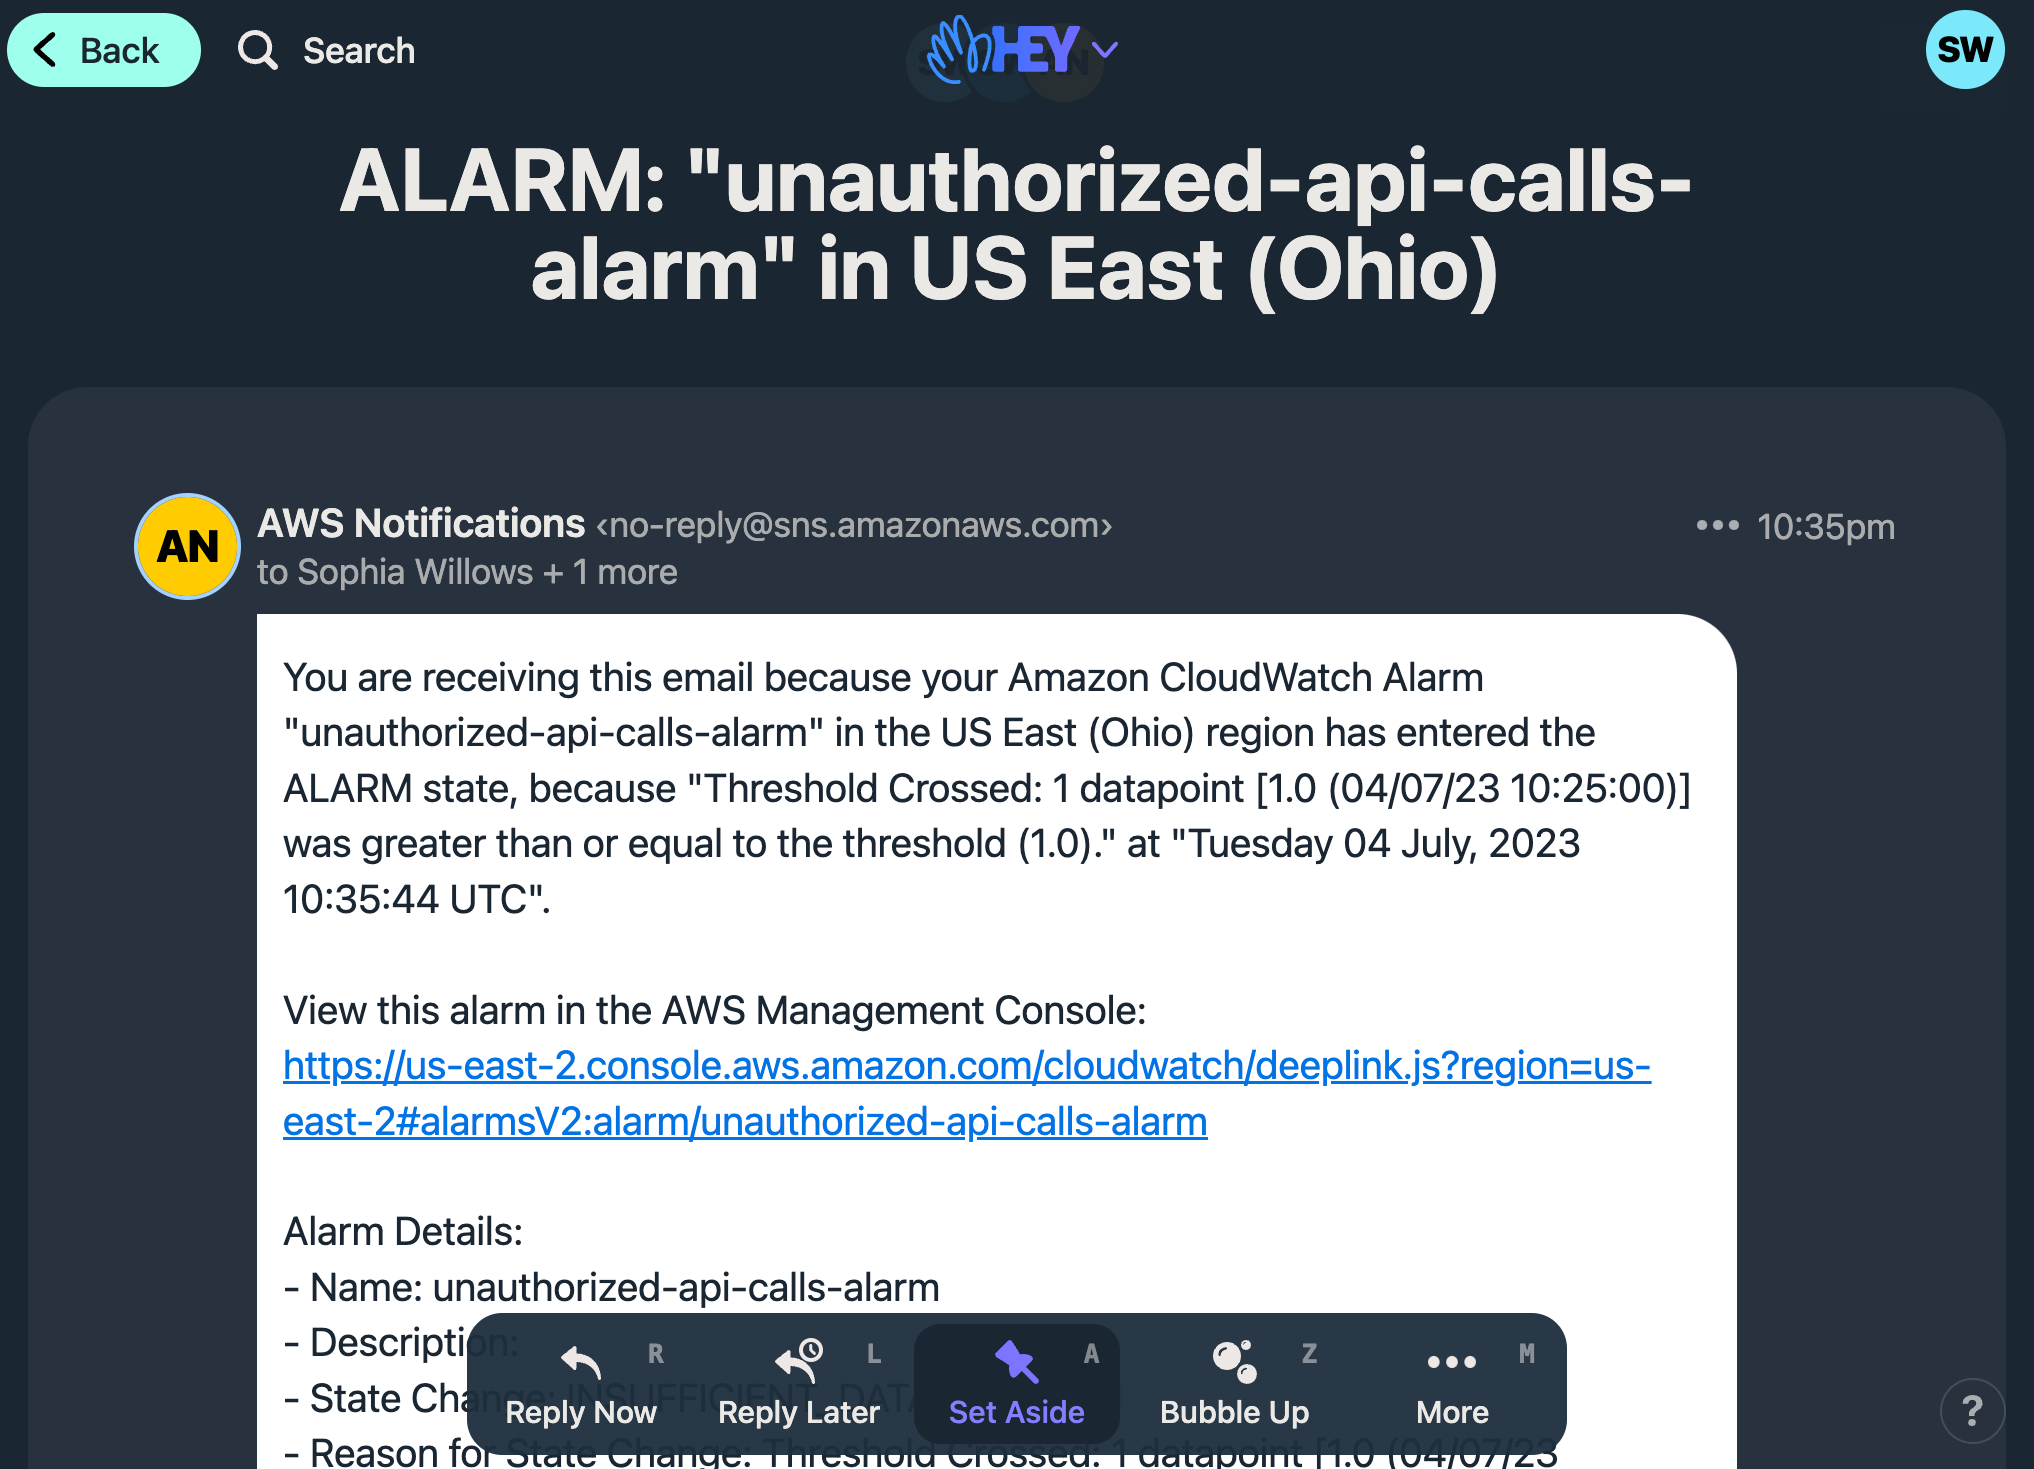
When I tested, I ran a ListBuckets command using AWS CLI v1. The exact command looked like the following, with the credentials for my dummy IAM user filled in: AWS_ACCESS_KEY_ID="..." AWS_SECRET_ACCESS_KEY="..." aws s3 ls --region us-east-2.
A minute or two after running that command and seeing an AccessDenied message in my terminal, I received the following email which confirms everything is working as expected:
Other considerations
We’ve only scratched the surface of CloudTrail’s capabilities in this post. There are lots of additional alerts you could consider setting up to further improve security posture, such as alerting when an AWS API call is made from a source IP that’s outside of the AWS region(s) your organization is using.
Under the AWS Free Tier the first copy of your “management events” get delivered to S3 for free. Most organizations can get by with only one trail, which is why I named the trail created in this post “cloudtrail” instead of something more specific. The other reason for this naming choice is that we haven’t configured any event filters on the trail which means this trail captures far more than just our unauthorized API calls. A simple name like “cloudtrail” is fine here.
On the topic of cost, a CloudTrail configured for an active AWS account can end up recording a lot of events. While the delivery of these events is free for your first trail, S3 and CloudWatch will still charge you for data storage. Depending on your needs you might want to configure object expiration in order to keep storage costs to a minimum.
Conclusion
In only a few minutes we set up CloudTrail to collect management events and store them in CloudWatch. From there we configured a metric filter which transforms events into an “unauthorized API calls” metric which we then used as a trigger for an alarm that emails us whenever an unauthorized API call is made. In doing this, we immediately improved our security posture and got the groundwork out of the way for further use of CloudTrail’s capabilities.